AWS Cost and Usage Report
- 1. What is the AWS Cost and Usage Report (CUR)?
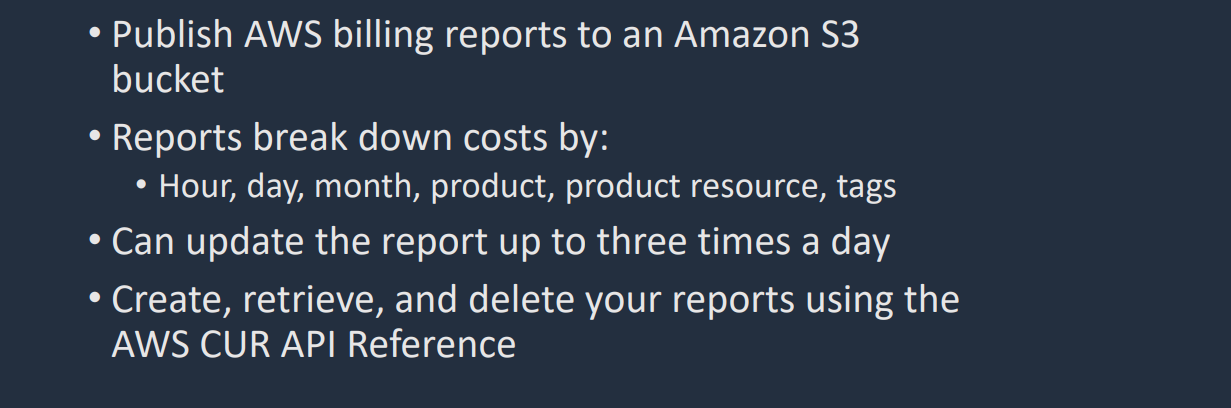
- Definition: The most comprehensive and granular set of cost and usage data available in AWS.
- Format: It is not a dashboard (like Cost Explorer). It is a raw data file (CSV or Parquet) that AWS delivers to an Amazon S3 bucket you define.
- Update Frequency: AWS updates the report in your bucket at least once a day.
- 2. Exam Keywords & Triggers
If you see these phrases in a question, CUR is likely the answer:
- "Most granular data available..."
- "Analyze costs at the individual resource ID level..."
- "Integrate billing data with third-party accounting tools..."
- "Use SQL to query billing data..." (implies CUR + Athena)
- "Create custom visualizations using Amazon QuickSight..."
- 3. Key Features for SAA-C03
- A. Granularity (The #1 Differentiator)
- Cost Explorer shows you costs by Service (e.g., "EC2") or Linked Account.
- CUR shows you costs by Resource ID (e.g., "i-1234567890abcdef0").
- Scenario: You need to find out exactly which specific EC2 instance contributed to a price spike at 2:00 AM. Cost Explorer might just show "EC2 rose," but CUR will show the specific instance ID and the exact hour.
- B. Integration Ecosystem (The Architecture Pattern)
The exam often tests the "pipeline" of cost analysis. You should memorize this flow:
- Source: AWS Billing generates the CUR.
- Storage: CUR is delivered to an S3 Bucket.
- Query: You use Amazon Athena to run SQL queries on the CUR files in S3.
- Visualize: You connect Amazon QuickSight to Athena to build custom dashboards.
- C. Cost Allocation Tags
- CUR includes all your active Cost Allocation Tags.
- Exam Tip: You must activate tags in the Billing Console before they appear in the CUR. They are not retroactive.
- D. Reserved Instances (RI) & Savings Plans
- CUR provides columns specifically for amortized costs, helping you understand how your RIs or Savings Plans are being applied across your accounts on an hourly basis.
- 4. The "Exam Trap": CUR vs. Cost Explorer vs. Budgets
The exam will try to confuse you. Use this table to pick the right tool:
| Feature | Cost Explorer | AWS Budgets | Cost & Usage Report (CUR) |
|---|---|---|---|
| Primary Goal | Visualize & Forecast | Alerting & Thresholds | Deep Analysis & Raw Data |
| Format | Dashboard / Graphs | Email / SNS Notification | CSV / Parquet files in S3 |
| Granularity | High-level (Service/Account) | Aggregate (Total spend) | Resource Level (Instance IDs) |
| Skill | "I want to see my spend." | "I want to be warned." | "I want to query my spend." |
| Exam Keyword | "Forecast" / "Trend" | "Alarm" / "Limit" | "Athena" / "Granular" / "BI Tool" |
- 5. Realistic Exam Scenario
Question: A company needs to perform a detailed analysis of their AWS costs to determine the exact storage cost of each individual S3 object and EC2 volume for internal chargeback. The solution must allow the use of standard SQL queries to analyze the data. Which solution should the Solutions Architect recommend?
- A) Use AWS Cost Explorer to filter by resource tags. (Incorrect - Cost Explorer is not for SQL or individual object/resource deep dives).
- B) Use AWS Budgets to set a threshold for S3 and EBS costs. (Incorrect - This alerts on cost, it doesn't analyze it).
- C) Enable the AWS Cost and Usage Report (CUR) to deliver files to an S3 bucket, and use Amazon Athena to query the data. (Correct - "Detailed analysis," "SQL," and "S3 delivery" match CUR).
- D) Use Amazon CloudWatch metrics to calculate the cost. (Incorrect - CloudWatch monitors performance/usage, not dollar costs).